SQL Developer for Dashboards
-
Posted by Harry E Fowler
- Last updated 2/25/21
- Share

Written by Paul James Guerin, DXC
Oracle Database 19c is the world’s leading relational database, and it gets even better when combined with Oracle SQL Developer.
Everyone knows that SQL Developer is a great tool for creating world-class applications. Not so well known, is that SQL Developer produces some amazing dashboards of the database and application operation.
These dashboards are relevant for both transactional, and data warehouse environments. To view the dashboards, the user account needs to be granted the SELECT_CATALOG_ROLE role.
To get started, choose the Instance Viewer from Database Status from the DBA menu.

Let’s examine the various indicators and dashboards available from the Instance Viewer.
The Basic Health Indicator
The most basic indicator gives just some simple details such as:
- Oracle version
- Uptime
- Operating system
- CPU count

The basic health indicator is appropriate for applications that are either transactional, or data warehouse in nature.
The Session/Transaction Indicators
A transaction occurs inside a session, but a transaction in one session can impact a transaction in another session. So, it’s useful to view the session status to determine if a transaction is impacting another transaction.
The session view in SQL Developer counts the total number of sessions, and the session total for:
- Blocked sessions
- Inactive sessions
- Active sessions

If a transaction locks an object (or part of an object), then another transaction in another session can be locked out.
Consequently, the transaction that is locked out will indicate that the session is blocked.

In the screenshot above, the session view shows there are 11 sessions in total, and 3 of those are blocked. Users that are relying on a transaction to finish will experience extended delays while its session is blocked.
This indicator is most relevant for applications that are transactional in nature.
Another session indicator is the accumulated wait summary of all sessions.

The accumulated wait summary can be used as a health check for an application that is transactional, where the lower the accumulated waits the better.
Then there is the DB CPU time ratio indicator which according to the official documentation are the database operations as a percentage of CPU activity.

The DB time is defined as:
- Time spent in the database by foreground sessions
- Includes CPU time, IO time, and wait time
- Excludes idle wait time.
As for the accumulated wait summary, the DB CPU time ratio could also be used as a health check for an application that is transactional.
The Cursor Dashboard
For overall cursor performance, the cursor dashboard shows the following metrics:
- Cursor execution rate
- Cursor parse rate
- Open cursors
- Cursor (or transaction) commit rate

There are also accumulated metrics for the top cursors (or SQL statements) still cached.
In a transactional application, cursors should be reused by different sessions when possible.
- Total CPU time
- Total disk I/O
- Total buffer gets
- Total executions
- Total elapsed time

If there are several SQL statements that are critical and are the most used, then it’s easy to calculate a performance metric.
One day, if a critical SQL statement uses, say, 10k I/O over 10 executions for an average of 1k I/O per execution, then the next day the average is 100k then that would be cause for further investigation because the efficiency is less.
Cursor performance is most helpful for applications that are transactional in nature.
The Capacity Summary Dashboards
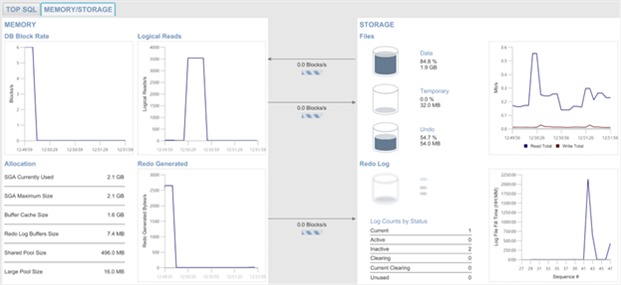
There are two capacity summaries: one for memory, and another for storage.
The memory capacity dashboard gives a snapshot of:
- DB block rate
- Logical reads
- Redo generated
The memory capacity dashboard indicates the level of workload being experienced by the database.
The second dashboard is for storage capacity, and there are workload graphs of:
- Total Read time and write time
- Log file fill time
There are also indicators for the storage capacity of 3 types of files:
- Data files
- Temporary files
- Undo files
The utilization metrics are really comparing the allocated file size with the usage size within the file.

In the above screenshot, there are utilization percentages against the data files, temporary files, and undo files. Those percentages are comparing the utilization of the allocated file, and don’t consider files that can auto-extend.
A file that can auto-extend will often have a utilization close to 100%.
There you are! For dashboards, you don’t need to look much farther than SQL Developer.
I say that SQL Developer should be renamed the SQL Dash boarder!
About the Author
Paul Guerin is an international consultant that specializes in Oracle Database. Paul is based from a global delivery center in South East Asia but has clients from Australia, Europe, Asia, and North America. Moreover, he has presented at some of the world’s leading Oracle conferences, including Oracle Open World 2013. Since 2015, his work has been featured in the IOUG Best Practices Tip Booklet, and in publications from AUSOUG, Oracle Technology Network, and Oracle Developers (Medium). In 2019, he was awarded as a most valued contributor for the My Oracle Support Community. He is a DBA OCP and continues to be a participant of the Oracle ACE program.
Interested in Writing for SELECT?
Are you interested in getting your writing published and sharing your knowledge with other Oracle users? Quest Oracle Community is looking for writers to contribute to the SELECT Journal for our Quest Database & Technology Community audience. We are looking for writers with expertise in a variety of topics, including the following:
- Database sharding
- Database security
- Database performance
- Database development
- Database auditing
- And more!
For more information about how to get involved, please email shelby.klingerman@questoraclecommunity.org.

