Orchestration Debugger: Troubleshoot More Easily and Build Better Orchestrations
-
Posted by Quest Editor
- Last updated 9/20/24
- Share

A recent JD Edwards YouTube video walked through the new Orchestration Debugger tool in Tools 9.2.4.3 and how it can help you troubleshoot more easily and build better orchestrations.
The JD Edwards EnterpriseOne Orchestrator is a key component of your JD Edwards digital platform. Orchestrator changes how you use your JD Edwards EnterpriseOne system and can transform the system from a transaction-based system of records into an ERP that provides a dynamic reflection of your real-time business operations – an ERP that participates in your business.
Orchestrator enables your EnterpriseOne system to integrate with other transformational technologies, such as Internet of Things (IoT), cloud services, robotic process automation (RPA), mobile applications, chatbots, and alternative user interfaces. Using Orchestrator, you can significantly improve your operations through notifications with action links, simplified processes, automated system administration, scheduled processes, and no-code extensions.
Some orchestrations might be simple – just even a single step. For these orchestrations, it is quite easy to pinpoint and correct any errors that might occur. Other orchestrations might be more complex with many steps and rules with true or false parts. In these cases, finding and fixing errors can be a bit more puzzling.
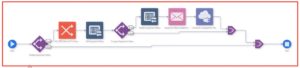
For example, you may have an orchestration with seven steps. Its job is to update the availability status of a piece of equipment.
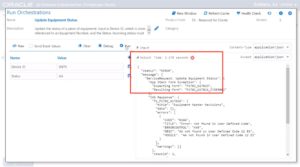
When you run this orchestration with SN70 as the device number and AA as the status, you can see that there is a problem, but it is not obvious where the problem is beginning.
Beginning with JD Edwards EnterpriseOne Tools Release 9.2.4.3, a new tool, the Orchestration Debugger, is available to help you easily find and resolve issues with your orchestrations. When you click the Debug button, you have access to a set of tools to help you find the issue in your orchestration.
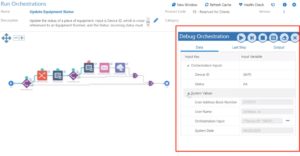
You can run the orchestration step-by-step to see which steps succeed and which fail. As you step through the orchestration, you can also see how the data is changing at each step and get visibility into how the orchestration is running.
When we run our example orchestration in the Orchestration Debugger, the red cross clearly shows which step is failing.

By hovering over the step, we can see details – such as the EnterpriseOne forms that the orchestration is calling and what input it expects.

Now, we can set a breakpoint on the step – just before the step. Green checkmarks indicates that everything is good up to this point. The Orchestration Debugger even displaced the variables at this point in the orchestration.
You will notice that the value of the input for status is AA. A business analyst might suspect that AA is not a valid status for equipment. The Orchestration Debugger allows you to change the value right in the Debugger for a what-if scenario and continue stepping through the orchestration.
For example, say we change the status value to DN. With the new value for status, we have corrected the problem and the step now succeeds – as indicated by a green checkmark. You can continue to step through the orchestration until it completes successfully and the green checkmark is displayed against each of the steps. The Orchestration Debugger shows the final output of the successful orchestration.
Now that you know the problem was an incorrect input, perhaps you can enhance the orchestrations that you might build later by checking for incorrect data and avoiding a similar error.
With the Orchestration Debugger, you can:
- Discover how to build orchestration that are resilient and fault-tolerant
- Set breakpoints, see the data at each step, and even change the data on the fly
- Quickly debug orchestrations
To learn more about debugging orchestrations, check out the video below.
