Overview of Kibana Analytics for PeopleSoft
-
Posted by Harry E Fowler
- Last updated 1/30/22
- Share

Kibana for PeopleSoft provides rich analytics and visualization with performance enhancements – enabling better decision-making and improved understanding of your data. Kibana is easy to install, configure, and maintain, and it provides superior performance in rendering visualizations. Kibana analytics don’t affect transactional processing because analytics are run against Elastic indexes, not the transactional database.
Overview of Kibana
Kibana was first delivered in PeopleTools 8.57 for technical administrators analyzing system and index metrics. With PeopleTools 8.58, Kibana is integrated with the PeopleSoft user interface. As PeopleSoft security is applied to the application data, only authorized users can access Kibana and see the data to which they have permission. This is based on the same security that’s applied to search index data. If you index data specifically for analytics, you will apply security the same way as for search indexes. You can also analyze structured and unstructured data and analyze relationships between data.
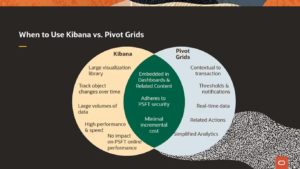
When to Use Kibana
Let’s take a look at some of the key factors when determining whether to use Kibana or pivot grids.
Kibana may be the right in the following situations:
- When you’re operating with large volumes of data
- Where performance is key
- If you want to analyze and track information over time
Pivot grids may be the right in the following situations:
- If your analytic is contextual to a transaction
- If you want to apply business rules through thresholds and notifications
- If you want to act directly on the data through related actions
- If you require fresh, real-time data in your analysis
Examples of Kibana in PeopleSoft
The Oracle video walked through an example of Kibana within PeopleSoft FSCM and HCM instances.
Kibana in PeopleSoft Financials
Start by accessing the Payables Operations homepage. You can see the Kibana analytic in the Early Detection and Monitoring tile.
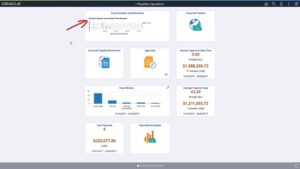
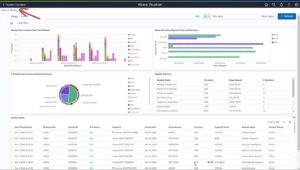
Click the tile to access the Kibana Visualizer page. You can now see the full dashboard while you’re still in PeopleSoft Financials with all of the navigation, security, and controls.

To expand the analytic, hover over the visualization and select full screen. Now, you can see all the details of the analytic. To minimize, hover over the top right and select “Minimize.”
You can use the elements in the dashboard as a filter. When you select a filter, you can see that all of the visualizations change automatically. In this example, the dashboard is filtered by US Dollars. Select USD in the pie chart analytic. Now, you can see that all content in the dashboard has changed to US Dollars.

Close the filter and return to the dashboard.
Kibana enables visualization of data across different time frames with a single click. This is easier and faster to render data than using multiple pivot grids. Change the time frame by selecting the option from the top of the page.

You can see the data applicable for the new timeframe “This Week.” You can see all transactions processed so far. You can also drill to the document status for a particular transaction.

Below, you can see across Procure to Pay view of the transaction, which shows the transaction lifeline across Procure to Pay. You can see that the invoice is identified as originating from a purchase order.

PeopleSoft Financials is focused on delivering high-value Kibana dashboards for financial operations, as it can handle voluminous data. Kibana is also delivered in HCM applications, especially in Talent Management and Recruiting.
Kibana in PeopleSoft HCM
In PeopleSoft HCM, using Kibana, you can see all of the data and information of your organization’s structure, employees, and applicants. This is presented in a dashboard with real-time search results. In the example below, using the Kibana analytic in the Workforce Administrator homepage, you can see your organization’s total headcount. To access visualizations, select the Employees by Department tile.

In the Kibana dashboard, you can see your organization’s headcount with easy-to-use visualizations. Total Number shows a key metric. Gauge Visualization shows differences between two categories. The Donut visualization shows the results of several categories like counts by departments, job codes, positions, locations, and others, all at once.

Also available in Kibana is a global heat map visualization that allows you to see all of your personnel in locations around the world. You can zoom in to any specific region to see a breakdown by state or province as needed. Hovering over any country or state will provide you with the total number of employees in that country. All of the visualizations shown on the dashboard are interoperable, which means that if you click “Alaska,” all of the data shown on the dashboard will reflect results for Alaska only.

Kibana delivers insights to support important decision-making. As you zoom in to a specific region, search results can be configured to show specific rows of data with important information and actionable links. From here, you can click on links that take you to menus within PeopleSoft for further action. The example below dives into Employee Snapshot.

Employee Snapshot opens in a new window. Kibana helps you work seamlessly with PeopleSoft pages to keep the user experience consistent and eliminate the need to exit PeopleSoft altogether.
Creating a New Visualization
Authorized users can use Kibana to customize visualizations. To do this, click the link “Open in Kibana” from the top left side of the page. The dashboard opens in a new window.
Select the Visualize icon to create a new visualization.
![]()
You can select any type of visualization you want to use. For this example, let’s select Pie. Search and select the data source from the list. Select the attribute of vouchers to be counted or analyzed. Next, you can specify the data element to count. Then, you can select the field that will be the basis of the count. Then, select the data attribute. Finally, apply the changes to create the visualization. You will see that the new visualization has been created successfully. It is easy to create a visualization with just a few clicks and selections. You can continue to make changes or save the visualization.
Requirements for Leveraging Kibana with PeopleSoft
Kibana is integrated into the PeopleSoft user interface with PeopleTools 8.58. This includes the ability to create tiles for Kibana dashboards and visualizations. These can appear on homepages and dashboards. In addition, you can include visualizations in related information for any PeopleSoft component. To take advantage of Kibana analytics with application data, you need PeopleTools 8.58, and you need to deploy the Elastic/Logstash/Kibana (ELK) DPK.
You can also use delivered application visualizations and dashboards by taking PUM Images delivered in PeopleTools 8.58. See the latest Image information to learn about what’s being delivered with each application.
Using Kibana, PeopleSoft delivers a rich, high-performance analytic platform that’s intuitive, easy-to-use, and fast to deploy.
To learn more about Kibana, visit www.peoplesoftinfo.com and check out the additional resources below.
