Leveraging PeopleSoft HR Workforce Insight Analytics
-
Posted by Harry E Fowler
- Last updated 12/05/23
- Share
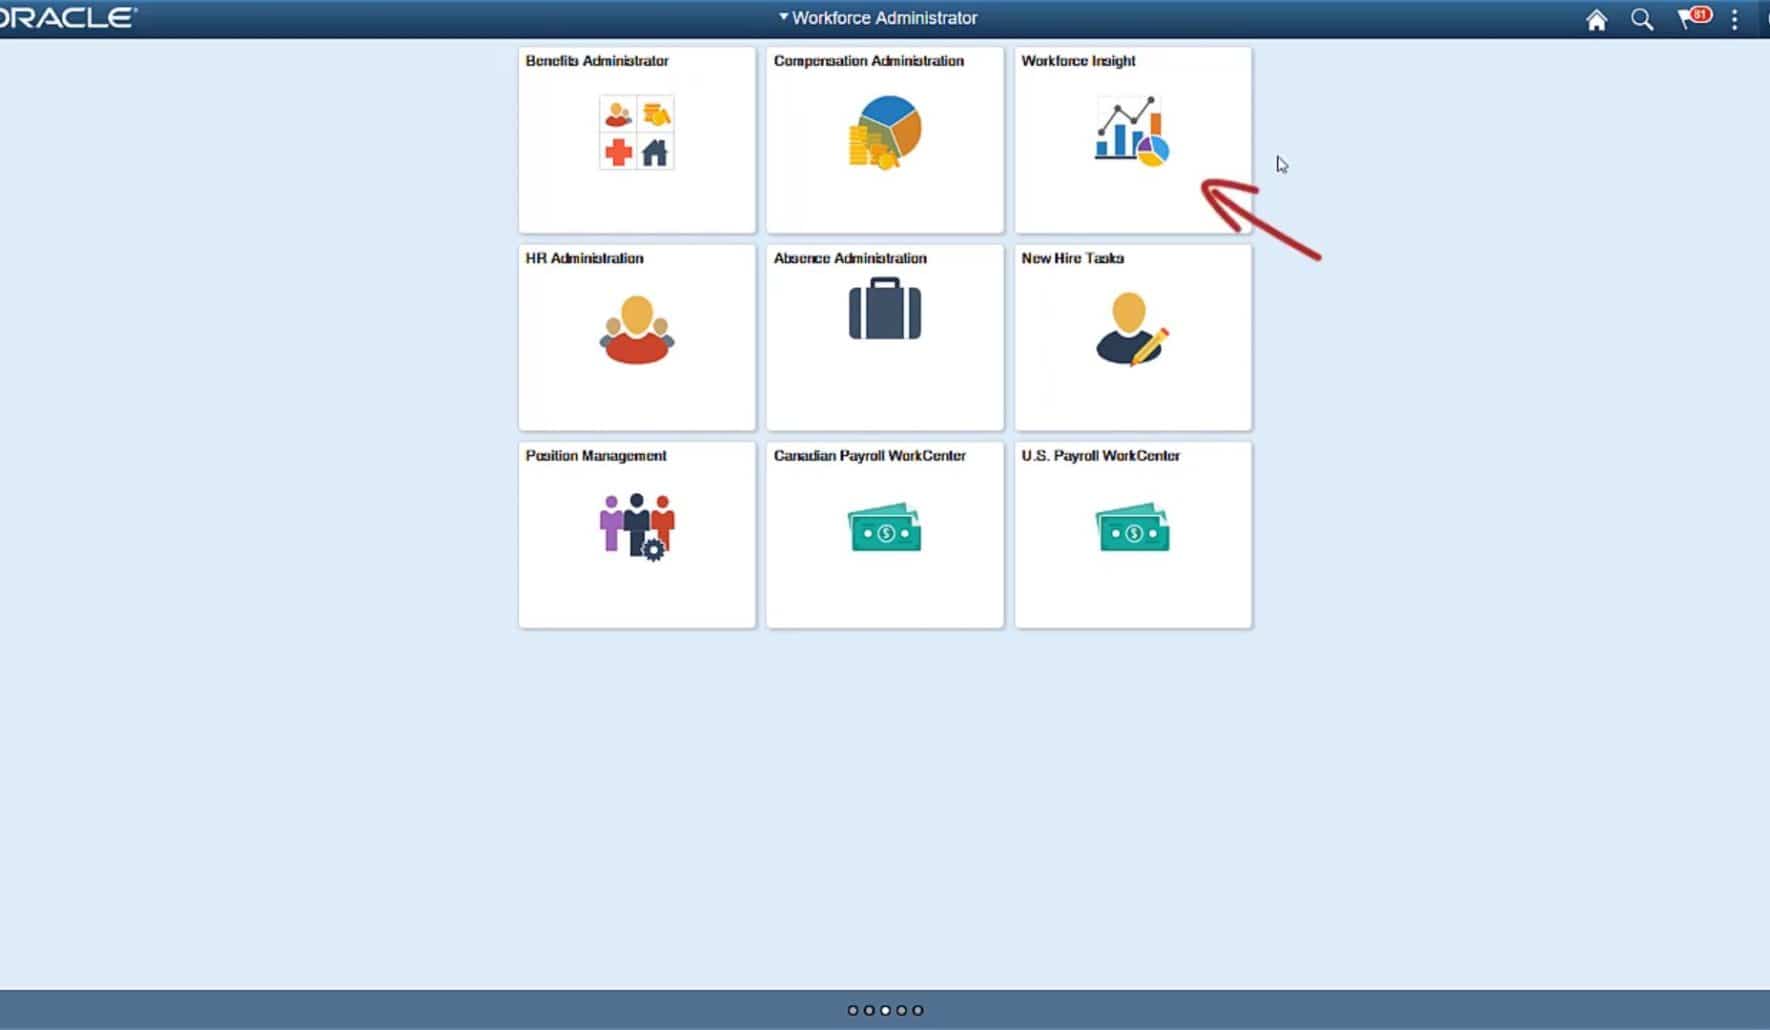
By leveraging PeopleSoft pivot grid technology, the PeopleSoft Workforce Insight dashboard enables users to view tiles with real-time workforce data. You can easily move between analytics for in-depth analysis from different vantage points.
PeopleSoft HCM delivers the HR Analytics Administrator role to secure the Workforce Insight dashboard and the individual analytics on the dashboard. Authorized users can access analytics from the dashboard.
Leveraging the Workforce Insight Dashboard
Workforce Insight delivers a number of pivot grids to provide reporting capabilities to your administrators. On the Workforce Insight dashboard, you can see analytics for:
- Headcount
- Workforce turnover
- Diversity
- Education level
- Position status reporting

Diversity Overview
The Diversity Overview analytics lets your administrators see workforce details by several diversity types, like age, disability, ethnicity, gender, or veteran status. You can drill down for more details about a specific diversity type. The system only counts employees once, regardless of the number of jobs a person holds.
You can use the Prompt button to show or hide the prompts and filters on the left panel.

Diversity Analysis
The Diversity Analysis Analytics tile lets you see the specific diversity types, one at a time, in more detail. In the example below, the Diversity Analysis analytic shows you how many employees are veterans. This is important because the United States Department of Labor’s benchmark for hiring U.S. veterans is approximately 7 percent. The system will notify your administrator when your organization’s veteran status falls below the level specified by the Threshold Personalization functionality for Fluid analytics delivered in PeopleTools 8.57.

You can personalize analytic notifications for important employee thresholds. Set up an alert notification using the Personalization icon. A threshold can be any type of value – an amount, an elapsed time limit, a quantity level, etc. When the system reaches a threshold, authorized users receive alerts by email or push notifications.
In the example below, your administrator receives a notification when the employee veteran status falls below the 7 percent threshold – shown with a red line in the analytic. Here, personalized alerts let your HR administrator easily see that the threshold is below 7 percent, so the administrator can engage the recruiting team to hire veterans.

Highest Education
Use the Highest Education analytic charts to see your employee’s highest education level by using personal data. With pivot grides, you can easily analyze the data using filters or just click on any of the colored areas. In the example below, if you want to know how many full-time vs. part-time employees have a bachelor’s degree, you can click on the bachelor’s degree pie slice and drill down to see results.
You can also choose the chart type. For example, you can choose between pie, bar, line, or horizontal bar chart.

Position Status
The Position Status analytics lets your administrators see vacant positions within the organization by approved or frozen status.
Workforce Turnover
The Workforce Turnover analytic lets you see areas within the organization with the highest turnover. This is another example of an analytic where you can use alerts and notifications. For example, you can set notifications when the turnover in a department or location exceeds a specified percentage.
Headcount Movement
The Headcount Movement analytic shows you job actions that occurred during a specified reporting period. The default is the latest 12 months. Use the Headcount Movement tile to analyze the headcount movement over a period of time within your organization by job actions, such as hires or terminations.
Current Headcount
The Current Headcount analytic enables your administrators to compare the distribution of the organizational population by an employee, contingent worker, and persons of interest based on current job effective dated row.
Conclusion
Pivot grids let your users display data and organize it by pivoting and filtering. The self-service, multi-dimensional analytics in the PeopleSoft HR Workforce Insight dashboard providers your HR administrators with the business intelligence they need to make informed decisions regarding your organization’s workforce.
